
Glycemic Index vs. Glycemic Load: Which One Matters?
The glycemic index (GI) ranks how quickly a carb-containing food raises blood sugar compared with pure glucose. The glycemic load (GL) takes that ranking and adjusts it for how many digestible carbs are in a normal serving. For everyday meals, GL is usually the more useful number, and on a low-carb or keto diet, the total amount of carbs you eat matters most of all.
What the glycemic index measures
To find a food’s GI, researchers give at least 10 healthy people a portion that contains 50 grams of digestible carbohydrate. On another day, the same people drink 50 grams of glucose. Blood sugar is checked over the next two hours, and the area under each person’s blood-sugar curve for the food is divided by the area for glucose. The average across the group becomes the GI [1].
Glucose is set at 100, and foods are grouped like this [2][3]:
- Low GI: 55 or less
- Medium GI: 56 to 69
- High GI: 70 or more
The most recent international GI tables, published in 2021, list more than 4,000 items. About 2,100 of them were tested with the method recommended by the International Organization for Standardization [4]. Dairy, legumes, pasta, and most fruits usually land in the low range, while breads, breakfast cereals, and rice can be high, medium, or low depending on how they’re made [4].
What glycemic load adds
GI has one big blind spot: it doesn’t consider how much of a food you actually eat [5]. A food can have a high GI but contain so few carbs per serving that it barely moves your blood sugar.
Glycemic load fixes that. You multiply the GI by the grams of digestible carbohydrate in a serving (fiber isn’t included) [3], then divide by 100. The cutoffs are [3][5]:
- Low GL: 10 or less
- Medium GL: 11 to 19
- High GL: 20 or more
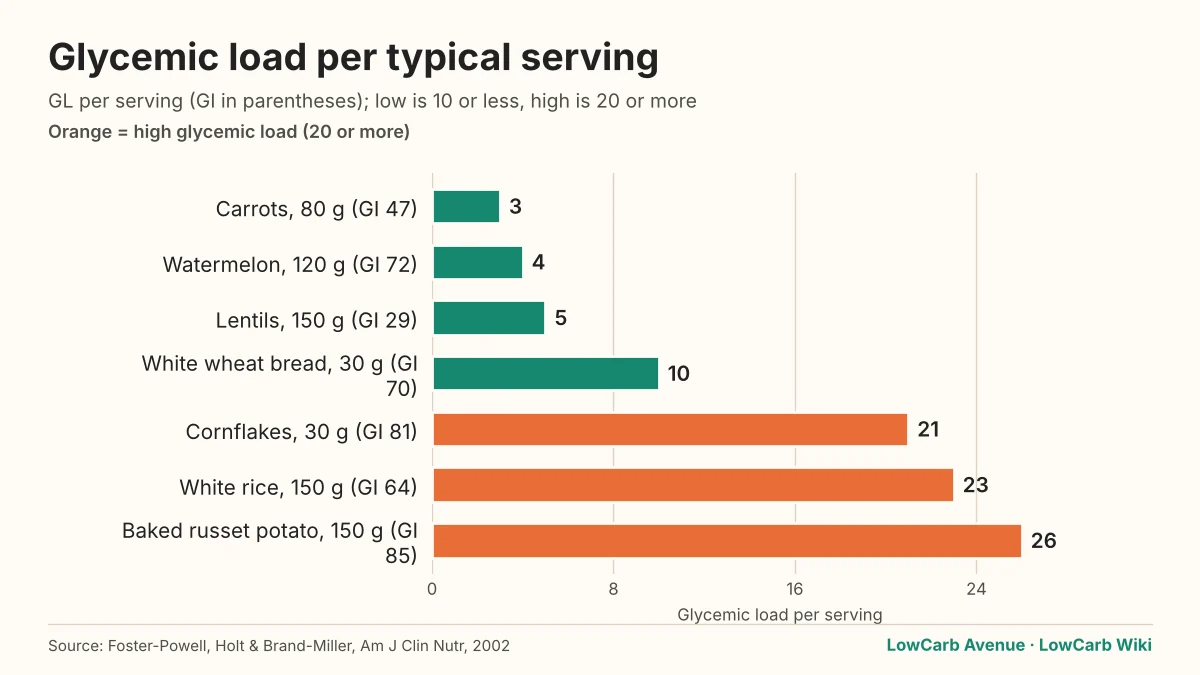
Watermelon is the classic example. Its GI is high, at 72, but a 120-gram serving has only a few grams of carbohydrate, so its GL is just 4 [6]. A baked russet potato tells the opposite story: a GI of 85 and a GL of 26 for a 150-gram serving, because it’s both fast to digest and packed with starch [6].
| Food (serving) | GI | GL per serving | What it means |
|---|---|---|---|
| Watermelon (120 g) | 72 | 4 | High GI, low GL |
| Carrots (80 g) | 47 | 3 | Low GI, low GL |
| Lentils (150 g) | 29 | 5 | Low GI, low GL |
| White wheat bread (30 g slice) | 70 | 10 | High GI, low GL (at the cutoff) |
| Cornflakes (30 g) | 81 | 21 | High GI, high GL |
| White rice (150 g) | 64 | 23 | Medium GI, high GL |
| Baked russet potato (150 g) | 85 | 26 | High GI, high GL |
Values from the 2002 international tables [6]. Different tests of the same food can give different numbers.
Why GI alone can mislead
It ignores portion size
Two slices of white bread have twice the glycemic load of one, even though the GI stays the same. GL is the only one of the two numbers that scales with your plate.
It says nothing about overall nutrition
A low GI doesn’t make a food healthy. Mayo Clinic points out that whole milk has a low GI and GL but is high in fat and calories, and that the GI lists include plenty of highly processed foods [5].
Meals change the math
GI is measured on one food eaten by itself. Real meals are mixed. Fat, fiber, and acid tend to slow digestion, while ripeness, cooking time, and processing can push GI up [3][2]. Al dente pasta, for example, has a lower GI than soft-cooked pasta [2].
Your body isn’t the average
In a Tufts University study of 63 healthy adults who ate the same white bread on several occasions, one person’s GI for that bread could differ by more than 60 points from one test to the next. On average, GI varied about 20% within the same person and about 25% between people [7].
A larger Israeli study tracked 800 people and 46,898 meals with continuous glucose monitors. Identical meals produced very different blood-sugar responses from one person to the next [8]. Published GI values are averages. They’re a starting point, not a prediction for you.
Bread is a good reminder
In the 2002 tables, average whole wheat bread had a GI of 71, almost the same as white wheat bread at 70 [6]. Whole grain bread often has other benefits, but the word “wheat” on a label doesn’t guarantee a gentler blood-sugar curve. Fermentation and ingredients can matter too; see our guide to sourdough and blood sugar.
What the research says about long-term health
Large cohort studies suggest both numbers have some value. A 2019 meta-analysis found that type 2 diabetes risk was 27% higher for every 10-point rise in the average GI of people’s diets. Risk was 26% higher for every 80-gram rise in daily glycemic load on a 2,000-calorie diet [9]. These are observational studies, so they show links rather than proof of cause.
Trials of low-GI diets have produced mixed results. Mayo Clinic notes that some of the reported benefits may come from the fact that these diets tend to be rich in fiber and minimally processed foods, rather than from GI alone [5]. Harvard’s Nutrition Source likewise points to research tying lower-GL diets to lower type 2 diabetes risk [3].
Which one matters on a low-carb or keto diet?
For most people eating low carb, glycemic load is more practical than GI, and total digestible carbs, often called net carbs, are more practical still. Here’s why: GL rises and falls with the grams of digestible carbohydrate in a serving. When you keep those grams low, the glycemic load of a meal stays low almost by default.
Foods made mostly of protein and fat, like eggs, meat, cheese, and avocado, don’t have a meaningful GI at all. The test needs a 50-gram serving of digestible carbs [1], and these foods have little or none.
Here’s a simple way to use both numbers:
- Count digestible carbs first. That’s the biggest lever for blood sugar on a low-carb plan.
- Use GL to compare portions. It tells you whether a serving of fruit, beans, or bread is likely to be a small bump or a big one.
- Use GI as a tiebreaker. Between two foods with similar carbs, the lower-GI one will usually raise blood sugar more slowly.
- Build balanced plates. Pair carbs with protein, healthy fat, and fiber, which tend to slow digestion [3].
- Check your own numbers. A glucose meter or CGM shows how your body handles a specific food, which matters more than a table average [8].
Keep in mind that added fibers in packaged low-carb foods change the carb count, too. Our guide to added fibers in keto bread explains how to read those labels, and keto vs. low-carb covers how strict you might want to be.
If you take insulin, other diabetes medication, or blood-pressure medication, talk with your doctor or a registered dietitian before you cut carbs sharply, since your doses may need to change.
Where LowCarb Avenue fits
Bread is often the hardest food to give up on a low-carb plan, which is why we bake ours to be low in net carbs and made with clean-label ingredients that bring real fiber and protein to the table. Wilbur is our multigrain loaf, Frankie and Elodie are our sourdoughs, and our Brooklyn Baby bagels cover breakfast. Like any food, they’re best judged by the label and by how they fit your own plan. Browse the lineup at lowcarbavenue.com/shop.
Frequently asked questions
What is the difference between glycemic index and glycemic load?
Glycemic index ranks how quickly a food's carbohydrate raises blood sugar compared with glucose, using a fixed 50-gram carb portion. Glycemic load adjusts that ranking for the carbs in a typical serving, so it reflects how much you actually eat.
What is a good glycemic load number?
A glycemic load of 10 or less per serving is considered low, 11 to 19 is medium, and 20 or more is high.
Is glycemic index useful on a keto diet?
It's less useful than on a higher-carb diet. Many keto staples like meat, eggs, and cheese have little or no carbohydrate, so they can't be given a meaningful GI. Tracking digestible carbs is usually more practical.
Why does watermelon have a high GI but a low GL?
Its sugar is absorbed quickly, which gives it a GI of 72. But a 120-gram serving contains only a few grams of carbohydrate, so its glycemic load is just 4.
Is whole wheat bread lower on the glycemic index than white bread?
Not by much. In the 2002 international tables, average whole wheat bread had a GI of 71 and white wheat bread had a GI of 70.
Sources
- About Glycemic Index.
- Glycemic index and diabetes.
- Carbohydrates and Blood Sugar.
- International tables of glycemic index and glycemic load values 2021: a systematic review (Atkinson et al.).
- Low-glycemic index diet: What's behind the claims?.
- International table of glycemic index and glycemic load values: 2002 (Foster-Powell, Holt, Brand-Miller).
- Estimating the reliability of glycemic index values and potential sources of methodological and biological variability (Matthan et al.).
- Personalized Nutrition by Prediction of Glycemic Responses (Zeevi et al.).
- Dietary Glycemic Index and Load and the Risk of Type 2 Diabetes: A Systematic Review and Updated Meta-Analyses of Prospective Cohort Studies (Livesey et al.).
This article is for general education and is not medical advice. Talk with your doctor or a registered dietitian before changing your diet, especially if you take medication for diabetes or blood pressure. How we research and write.